

Rates are back above 6.5%, but buyers north of Nashville have more listings, more time, and more negotiating room than they’ve had in years. Here’s how I’d actually think about it.
This is one of the most common buyer questions I’m getting right now, and I understand why.
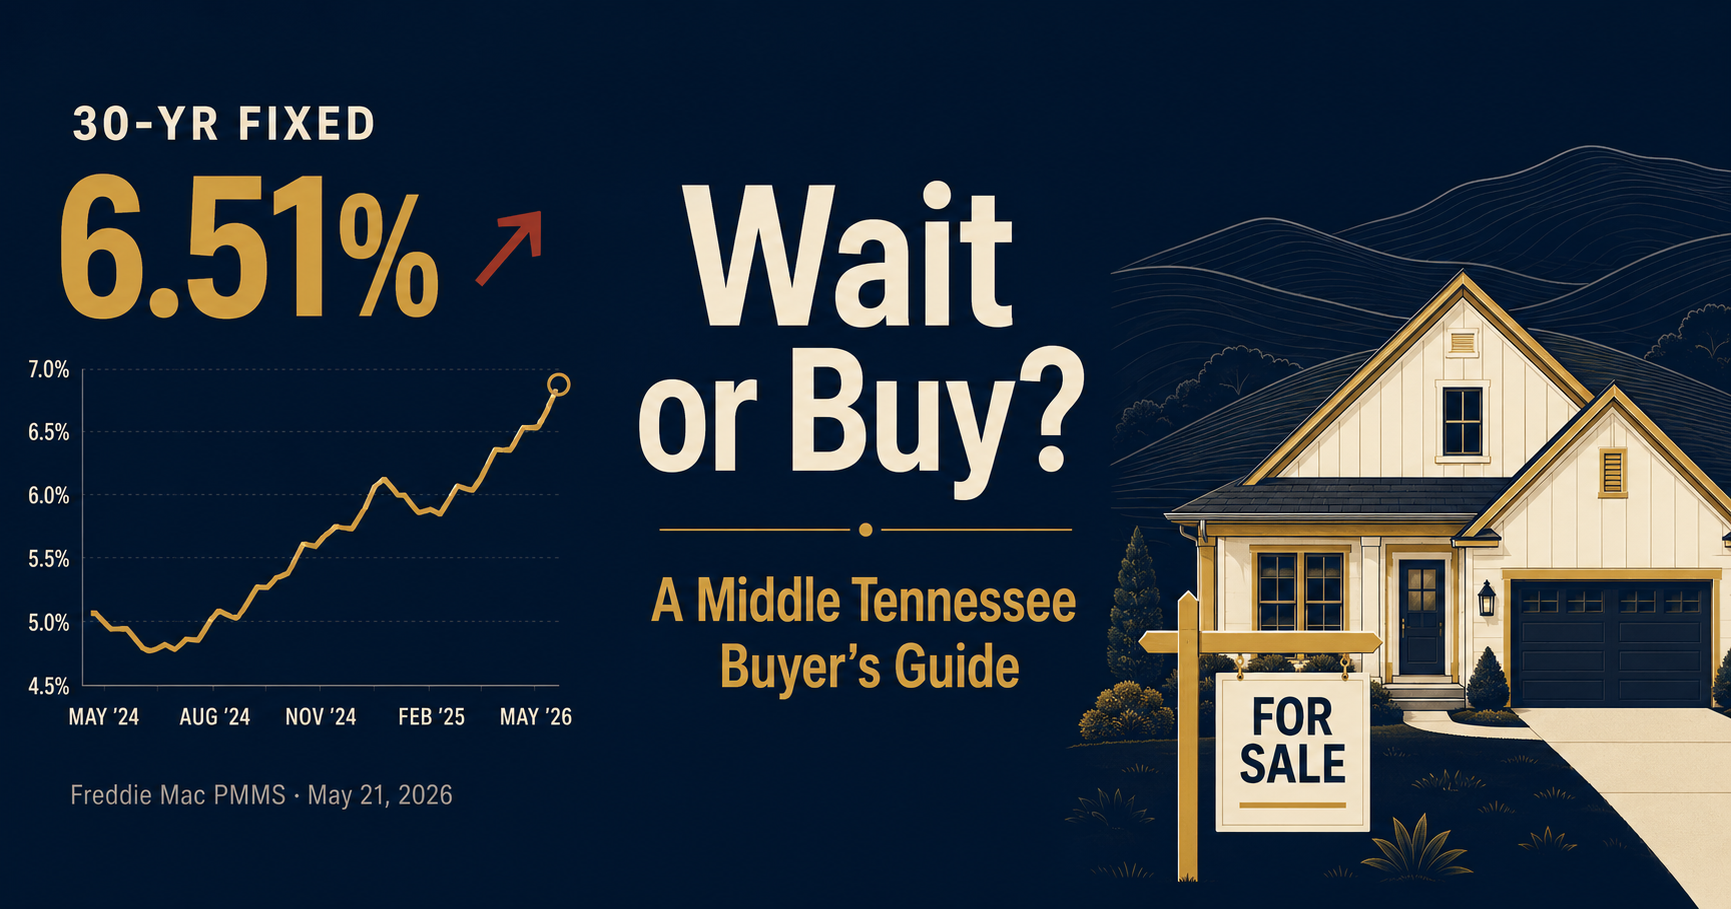
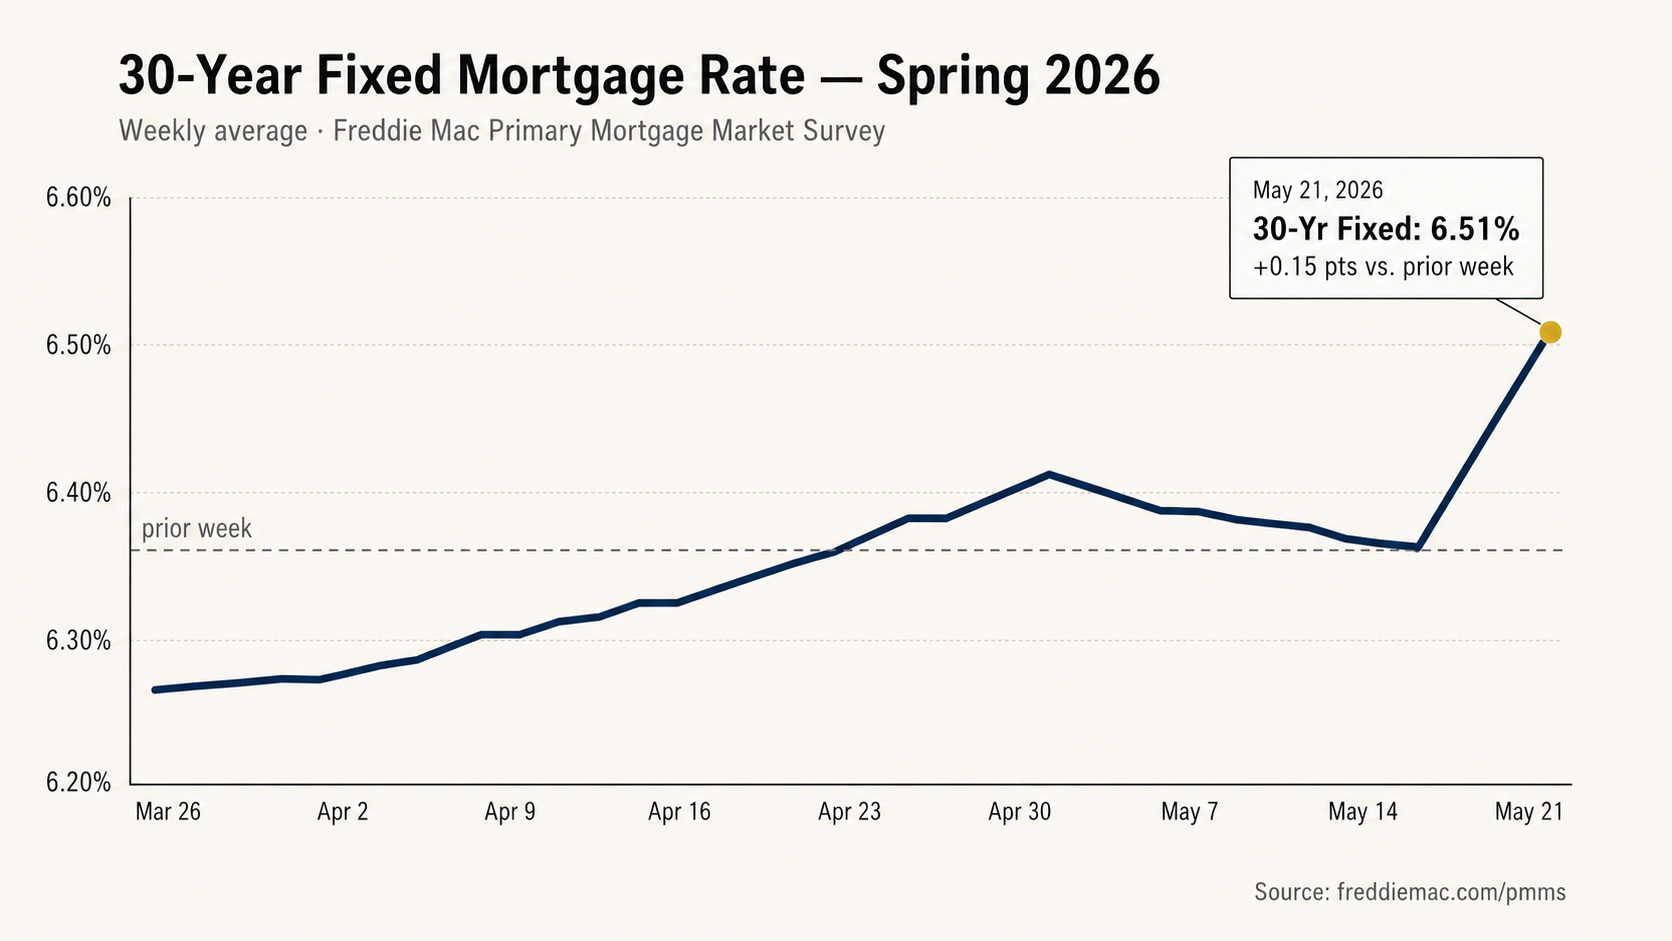
Mortgage rates matter. Even a half-point change can meaningfully shift a monthly payment. According to the Freddie Mac Primary Mortgage Market Survey, the average 30-year fixed mortgage was 6.51% as of May 21, 2026 — up from 6.36% the week before. The 15-year fixed sat at 5.85%, up from 5.71%.
So the instinct makes sense:
“If rates drop later, maybe I should just wait.”
The problem is that rate shopping and market timing are two different things — and the math on “waiting” usually isn’t as clean as it sounds.
What’s Actually Happening in Middle Tennessee Right Now
National headlines are useful for context, but you’re not buying the national market. You’re buying a specific home, on a specific street, with a specific monthly payment.
Locally, the broader Nashville market has shifted noticeably toward balance. According to the most recent Greater Nashville REALTORS® market data, April 2026 closed with:
- 14,677 total active listings across the nine-county region (about 9,800 of them residential)
- 3,016 pending sales, up from 2,743 in April 2025
- An average of 57 days on market for single-family homes
- A median single-family price of $503,340 — roughly flat year over year
- Approximately 6 months of available inventory, which GNR identifies as a benchmark of a balanced market
Drill into the city of Nashville specifically and the asking-price picture is sharper. The Realtor.com Nashville market snapshot (May 2026) shows:
- Median listing price: $538,227 — down 3.02% year over year and 8.78% over three years
- Median sold price: $479,900 — essentially flat YoY (+0.19%) but still +11.06% over three years
- $305 per square foot — down 2.87% YoY and 3.79% over three years
- 6,331 active listings citywide — up 15.30% YoY and 72.48% over three years
- Median days on market: 53 — flat YoY, but up 65.63% from three years ago
Two things jump out of that table. First, the gap between asking prices (falling) and sold prices (flat) tells you sellers are pricing more aggressively while homes that are priced right are still closing near market value. Second, the three-year change in active listings (+72%) and days on market (+66%) shows how dramatically the dynamic has shifted from the 2022 frenzy.
Nationally, the direction is the same. Per Realtor.com’s April 2026 monthly report, active listings rose 4.6% year over year and the U.S. median list price fell 1.4% YoY — the sixth consecutive month of national price declines.
In plain English: rates are higher, but inventory is up, days on market are longer, and the negotiating dynamic has changed. That’s a fundamentally different market than 2021 or 2022.
What Waiting Can Actually Help With
I want to be fair to the “wait it out” side, because it isn’t crazy.
If 30-year rates drop a full point or more from today’s level, the math changes meaningfully:
- A $400,000 loan at 6.51% runs about $2,530/month in P&I.
- The same loan at 5.50% runs about $2,271/month — roughly $260 less per month, or about $3,100 a year.
Over a 5–7 year holding period, that’s real money. So if the only thing that mattered was the interest rate, waiting could pencil out.
The catch is that the rate isn’t the only thing that changes.
What Waiting Can Cost You
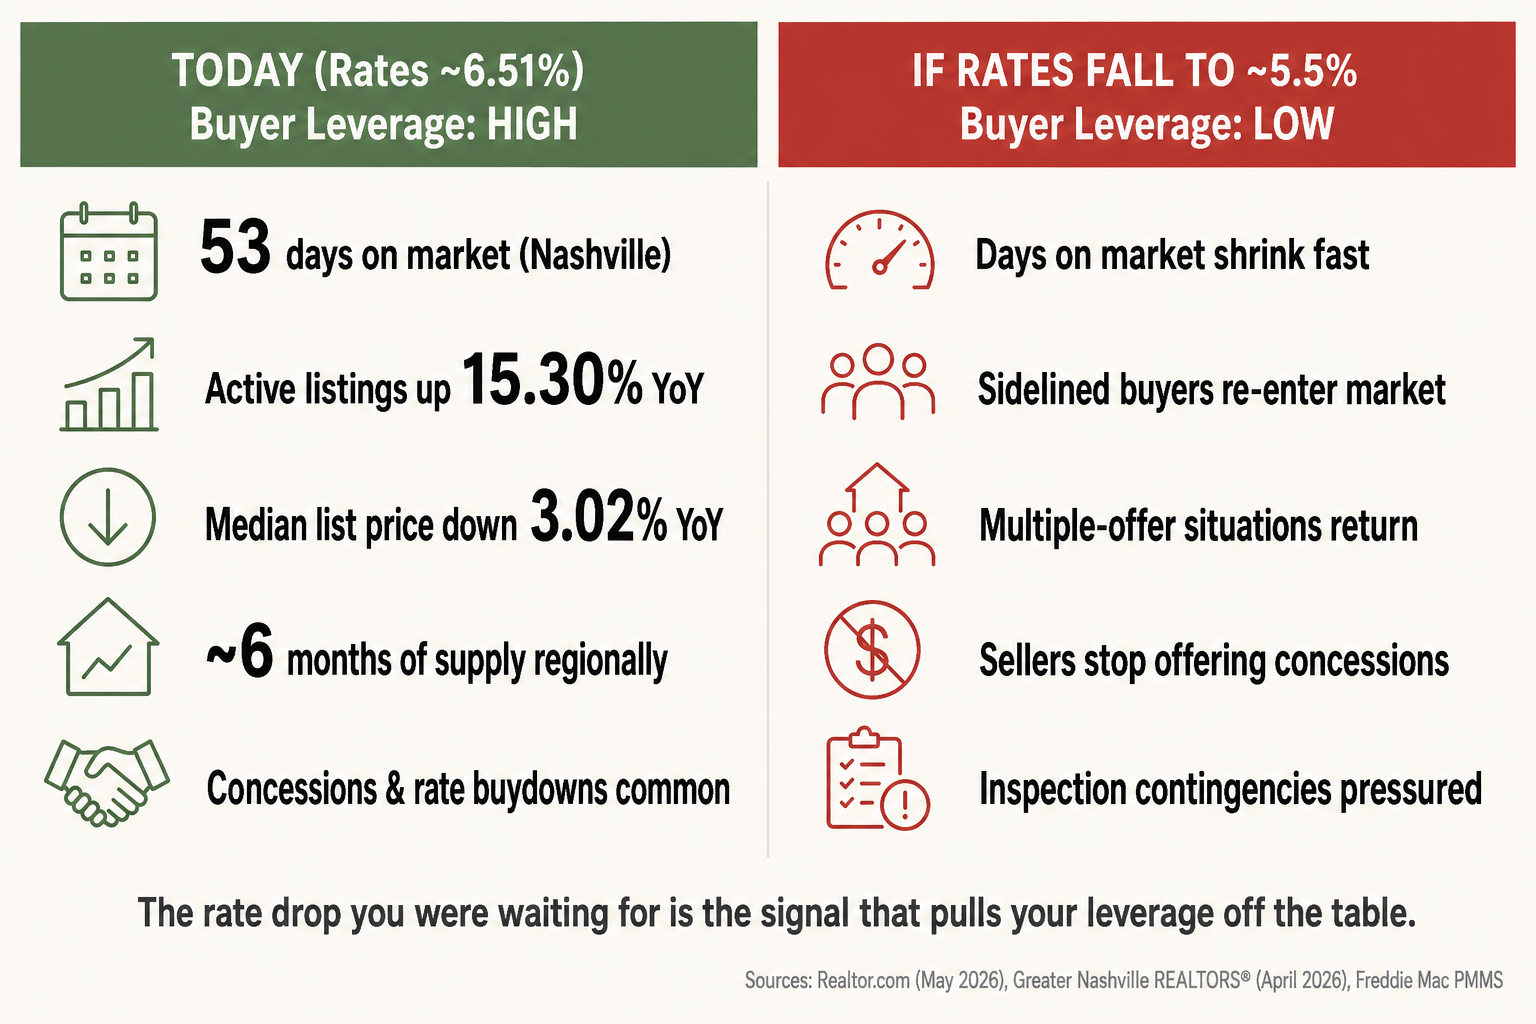
Here’s the part most “should I wait?” articles glide over. If rates fall meaningfully, affordability improves for every other buyer too — and those buyers come back into the market all at once.
Practically, that often looks like:
- Fewer seller concessions. Rate buydowns, closing-cost credits, and repair credits dry up fast when sellers stop sweating their days on market.
- More multiple-offer situations. Especially on well-priced homes in desirable school zones north of Nashville.
- Less room to negotiate inspection findings. When you’re competing again, that $4,800 HVAC concession quietly disappears.
- Faster price firming. Asking prices that were sitting today get refreshed and re-priced once buyer demand rebounds.
- More pressure to skip due diligence. Inspection contingencies, financing contingencies, and reasonable closing timelines all start getting trimmed when buyers compete.
In other words, the rate drop you were waiting for becomes the signal that pulls the rest of your leverage off the table.
This is how rate-driven markets tend to work. Buyers who hold out for the “perfect” rate often end up paying more in total — through a higher purchase price, no concessions, and inspection items they had to eat — than buyers who bought when conditions were softer.
The Real Decision Framework
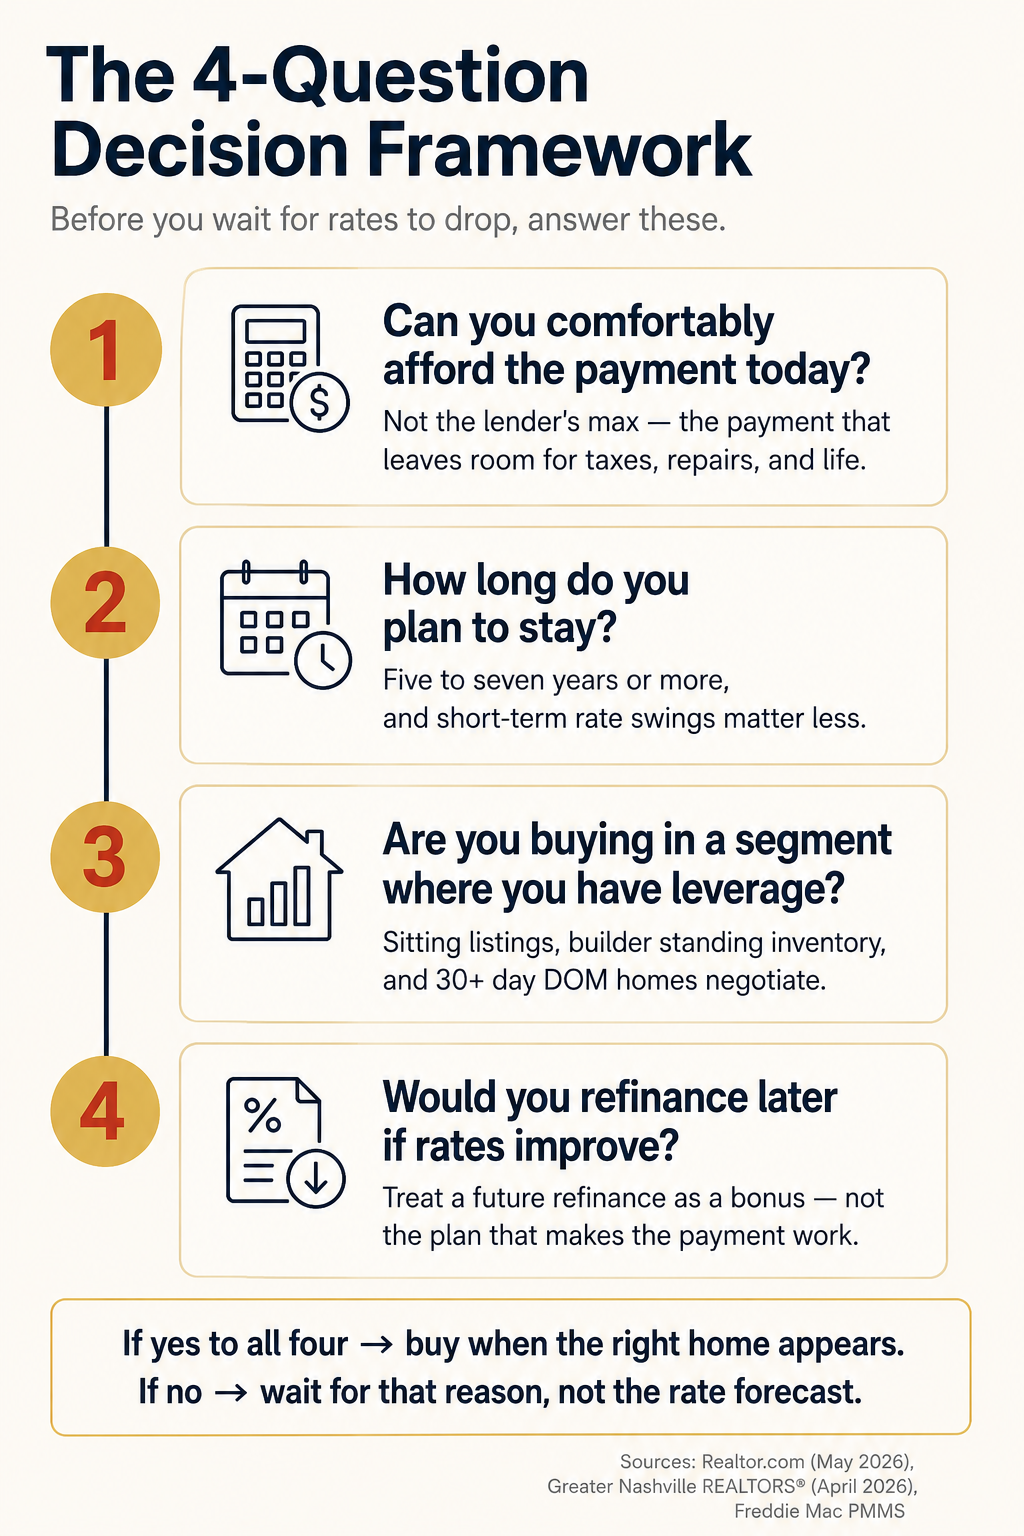
Instead of “Should I wait for rates?”, I walk buyers through four questions. They’re more useful, and they actually have answers.
1. Can you comfortably afford the payment today?
Not “would the lender approve me” — those are different numbers. I’m asking whether today’s payment leaves room for property taxes going up, an HVAC repair, a higher insurance renewal, and a vacation once in a while.
If the payment only works on paper, that’s a signal to wait — or to look at a different price point. Not because rates will drop, but because the math has to work for you on closing day.
2. How long do you plan to stay?
If you’re confident you’ll be in the home five to seven years or more, short-term rate movement matters less. Equity, principal paydown, and life stability start doing the heavy lifting.
If there’s a real chance you’ll move again in two or three years, a tight payment is much riskier — and a wait-and-see approach makes more sense.
3. Are you buying in a segment where you have leverage?
This is where Middle Tennessee gets interesting. With 6 months of inventory regionally and 57 days on market, sellers in many price bands are negotiating again — especially on:
- Homes that have been sitting 30+ days
- New construction with standing inventory (builders in the White House and Portland I-65 corridor are still offering meaningful incentive packages)
- Homes with cosmetic issues, deferred maintenance, or unconventional layouts that scared off the spring rush
When you have leverage, today’s higher rate can be offset by rate buydowns, closing cost concessions, repair credits, or price reductions that simply weren’t on the table three years ago. A 2-1 buydown alone can shave several hundred dollars off your monthly payment in year one — and unlike a hoped-for refinance, it’s locked in at closing.
4. Would you refinance later if rates improve?
This is a strategy I see work for many buyers, but only when it’s used the right way.
The right way: Buy a home you can afford at today’s rate. If rates fall meaningfully later and the refinance math works, you refinance into a lower payment. That’s a bonus.
The wrong way: Stretch into a payment that only works if you can refinance later. There’s no guarantee rates fall on your timeline, and refinancing has real closing costs that have to be earned back through monthly savings.
This is professional interpretation, not a prediction about where rates go. I covered some of the mechanics in my earlier post on oil prices and mortgage rates and in Understanding Mortgage Rates — rate movement depends on bond markets, inflation, and global events, not the calendar.
Why This Matters More North of Nashville
The towns north of Nashville don’t move in perfect sync with the metro headline numbers. White House, Portland, Greenbrier, Cottontown, Springfield, Gallatin, Hendersonville, and Goodlettsville each behave a little differently based on:
- New construction supply (especially in the I-65 corridor)
- Commute economics and traffic patterns
- School zoning and zone changes
- Lot size, septic vs. sewer, and acreage availability
- Local employers and remote-work demographics
A buyer shopping a $475K resale in White House and a buyer shopping a $625K new-construction home in Hendersonville are essentially in two different micro-markets. The rate environment is the same, but the leverage, the comps, and the competition are not.
This is why I push back when a buyer tells me they’re “waiting for the Nashville market to drop.” There is no single Nashville market. There’s a Sumner County market, a Robertson County market, a Davidson County market, a downtown condo market, a lake market, and a half-dozen suburban submarkets — and they don’t all bend the same way to the same rate change.
What I’d Actually Recommend
If you’re a serious buyer in Middle Tennessee right now, here’s where I’d land:
Don’t sit on the sidelines waiting for a rate forecast to come true. Forecasts have been wrong consistently for the last four years. The buyers who did the best in 2021–2022 didn’t time the bottom — they bought when they were ready, in homes they could afford, and let the market work over a five-to-ten-year horizon.
Do use this market to your advantage. Get pre-approved with a lender who’ll actually talk through buydown structures and concession scenarios. Watch the local submarkets that fit your life — not just the metro headline. And be ready to move on the right home when it appears, because in a balanced market the good listings still go quickly. It’s the overpriced ones that sit.
If you’re thinking about selling first, the math is different and the timing matters. I broke that down in Should I Buy Now or Wait in Middle Tennessee?, and the contingent-vs-bridge decision is worth its own conversation — which I walk through with a real client story in How a Bridge Loan Let My Buyers Win the Home Before Selling Theirs.
Bottom Line
Waiting for rates to drop is not automatically the right move — even at 6.51%.
If you can comfortably afford today’s payment, plan to stay for several years, and find a home that fits your life, this market is offering things that disappear quickly the moment rates fall: more inventory, more time, more seller flexibility, and real negotiating leverage on price, repairs, and rate buydowns.
If your budget is tight, your situation is unstable, or you don’t yet know which town fits you, then wait — but wait for those reasons, not because you’re trying to time a rate cycle no one can predict.
The right decision isn’t built on a Freddie Mac chart. It’s built on your numbers, your timeline, and the specific home in front of you.
If you want help walking through your situation, that’s the conversation I have every day. You can book a consult or reach me directly at (615) 491-1638.
Sources: Freddie Mac Primary Mortgage Market Survey, Greater Nashville REALTORS® Market Data Monthly, Greater Nashville REALTORS® Home Sales Release archive, Realtor.com Nashville, TN market summary, Realtor.com Research — April 2026 Monthly Housing Report.
